
.png)
Appalachian Learning Initiative
Infographics Database
About This Page:
Welcome to the Appalachian Learning Initiative's Infographics Resource. This resource allows users to select one of the 13 Appalachian states and view state- and county-level data about adult literacy and numeracy, population demographics, quality of life statistics, and the public health measures that impact Appalachians.
Users will also find infographics for all 423 counties and 8 independent Virginia cities in the Appalachian Region which are free to the public and available for download and distribution.
.png)
We hope that our users will be able to turn these data into local- and state-level advocacy by working to increase funding for adult literacy and numeracy.
Here are a couple of tips to help users access and utilize the information they'll find:
-
If a data point reads "Suppressed," this means that there were fewer than 10 cases in a jurisdiction. Because of this, the exact numbers have been hidden to protect the patients' identities.
-
Incidence and mortality rates are rates per 100,000 residents (e.g., HIV Diagnosis Rate)
-
Our sources for these data may be found on our Resources page in the Citations section.
We truly hope that everyone enjoys this resource. Please remember to share these infographics with your networks and help us to spread the word about adult literacy and numeracy in Appalachia.
Sincerely,
Marcus J. Hopkins
Founder & Executive Director
Select a Jurisdiction
Alabama
Franklin County
Adults Reading At/Below
an 8th Grade Level:
71.6%


Adults Struggling with Basic Mathematics:
79.1%
Demographics (2023)
Population:
Male:
Female:
White:
Black:
Hispanic:
Asian:
American Indian /
Alaska Native:
Native Hawaiian /
Pacific Islander:
Other:
31,802
50.1%
49.9%
91.3%
4.4%
20.6%
0.4%
1.8%
0.2%
1.9%
Quality of Life Statistics
Adults Who Haven't
Finished High School (2023):
Residents Earning Below
150% of the Federal
Poverty Level (2023):
Residents Earning Below 100%
of the Federal Poverty Level:
Residents Who Rely on SNAP
for Nutrition Assistance (2023):
Residents Who Lack
Health Insurance (2023):
Residents Spending
50%+of Their Income
on Housing (2023):
Residents Facing
Food Insecurity (2022):
Households Paying $200+ Per Month on Electricity (2023):
Public Health Statistics
Drug Overdose
Death Rate (2022):
HIV Diagnoses Rate (2022):
HIV Prevalence (2022):
Adults Who Currently
Smoke Cigarettes (2023):
Adults Living with
Obesity (2022):
Adults with Diabetes (2022):
Adults with Asthma (2022):
Adults with COPD (2022):
Adults with CHD (2022):
Adults with a Disability (2022):
Hale County
Adults Reading At/Below
an 8th Grade Level:
80.5%

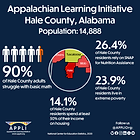
Adults Struggling with Basic Mathematics:
90.0%
Demographics (2023)
Population:
Male:
Female:
White:
Black:
Hispanic:
Asian:
American Indian /
Alaska Native:
Native Hawaiian /
Pacific Islander:
Other:
14,888
47.3%
52.7%
40.2%
58.0%
1.3%
0.4%
0.3%
0.0%
1.1%
Quality of Life Statistics
Adults Who Haven't
Finished High School (2023):
Residents Earning Below
150% of the Federal
Poverty Level (2023):
Residents Earning Below 100%
of the Federal Poverty Level:
Residents Who Rely on SNAP
for Nutrition Assistance (2023):
Residents Who Lack
Health Insurance (2023):
Residents Spending
50%+of Their Income
on Housing (2023):
Residents Facing
Food Insecurity (2022):
Households Paying $200+ Per Month on Electricity (2023):
Public Health Statistics
Drug Overdose
Death Rate (2022):
HIV Diagnoses Rate (2022):
HIV Prevalence (2022):
Adults Who Currently
Smoke Cigarettes (2023):
Adults Living with
Obesity (2022):
Adults with Diabetes (2022):
Adults with Asthma (2022):
Adults with COPD (2022):
Adults with CHD (2022):
Adults with a Disability (2022):
Jackson County
Adults Reading At/Below
an 8th Grade Level:
67.2%
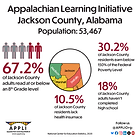

Adults Struggling with Basic Mathematics:
76.4%
Demographics (2023)
Population:
Male:
Female:
White:
Black:
Hispanic:
Asian:
American Indian /
Alaska Native:
Native Hawaiian /
Pacific Islander:
Other:
53,467
49.4%
50.6%
91.1%
3.5%
3.7%
0.6%
1.6%
0.1%
3.1%
Quality of Life Statistics
Adults Who Haven't
Finished High School (2023):
Residents Earning Below
150% of the Federal
Poverty Level (2023):
Residents Earning Below 100%
of the Federal Poverty Level:
Residents Who Rely on SNAP
for Nutrition Assistance (2023):
Residents Who Lack
Health Insurance (2023):
Residents Spending
50%+of Their Income
on Housing (2023):
Residents Facing
Food Insecurity (2022):
Households Paying $200+ Per Month on Electricity (2023):
Public Health Statistics
Drug Overdose
Death Rate (2022):
HIV Diagnoses Rate (2022):
HIV Prevalence (2022):
Adults Who Currently
Smoke Cigarettes (2023):
Adults Living with
Obesity (2022):
Adults with Diabetes (2022):
Adults with Asthma (2022):
Adults with COPD (2022):
Adults with CHD (2022):
Adults with a Disability (2022):
Jefferson County
Adults Reading At/Below
an 8th Grade Level:
56.8%
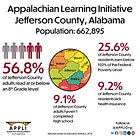
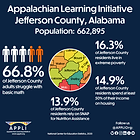
Adults Struggling with Basic Mathematics:
66.8%
Demographics (2023)
Population:
Male:
Female:
White:
Black:
Hispanic:
Asian:
American Indian /
Alaska Native:
Native Hawaiian /
Pacific Islander:
Other:
662,895
47.4%
52.6%
52.9%
43.4%
5.5%
1.9%
0.3%
0.1%
1.5%
Quality of Life Statistics
Adults Who Haven't
Finished High School (2023):
Residents Earning Below
150% of the Federal
Poverty Level (2023):
Residents Earning Below 100%
of the Federal Poverty Level:
Residents Who Rely on SNAP
for Nutrition Assistance (2023):
Residents Who Lack
Health Insurance (2023):
Residents Spending
50%+of Their Income
on Housing (2023):
Residents Facing
Food Insecurity (2022):
Households Paying $200+ Per Month on Electricity (2023):
Public Health Statistics
Drug Overdose
Death Rate (2022):
HIV Diagnoses Rate (2022):
HIV Prevalence (2022):
Adults Who Currently
Smoke Cigarettes (2023):
Adults Living with
Obesity (2022):
Adults with Diabetes (2022):
Adults with Asthma (2022):
Adults with COPD (2022):
Adults with CHD (2022):
Adults with a Disability (2022):
Lamar County
Adults Reading At/Below
an 8th Grade Level:
68.1%


Adults Struggling with Basic Mathematics:
76.2%
Demographics (2023)
Population:
Male:
Female:
White:
Black:
Hispanic:
Asian:
American Indian /
Alaska Native:
Native Hawaiian /
Pacific Islander:
Other:
13,661
49.4%
50.6%
87.2%
10.3%
2.0%
0.1%
0.5%
0.0%
1.9%
Quality of Life Statistics
Adults Who Haven't
Finished High School (2023):
Residents Earning Below
150% of the Federal
Poverty Level (2023):
Residents Earning Below 100%
of the Federal Poverty Level:
Residents Who Rely on SNAP
for Nutrition Assistance (2023):
Residents Who Lack
Health Insurance (2023):
Residents Spending
50%+of Their Income
on Housing (2023):
Residents Facing
Food Insecurity (2022):
Households Paying $200+ Per Month on Electricity (2023):
Public Health Statistics
Drug Overdose
Death Rate (2022):
HIV Diagnoses Rate (2022):
HIV Prevalence (2022):
Adults Who Currently
Smoke Cigarettes (2023):
Adults Living with
Obesity (2022):
Adults with Diabetes (2022):
Adults with Asthma (2022):
Adults with COPD (2022):
Adults with CHD (2022):
Adults with a Disability (2022):